ABM workflow
The system on paper before the system in production - from TAM mapping to pipeline reporting, with every handoff defined.
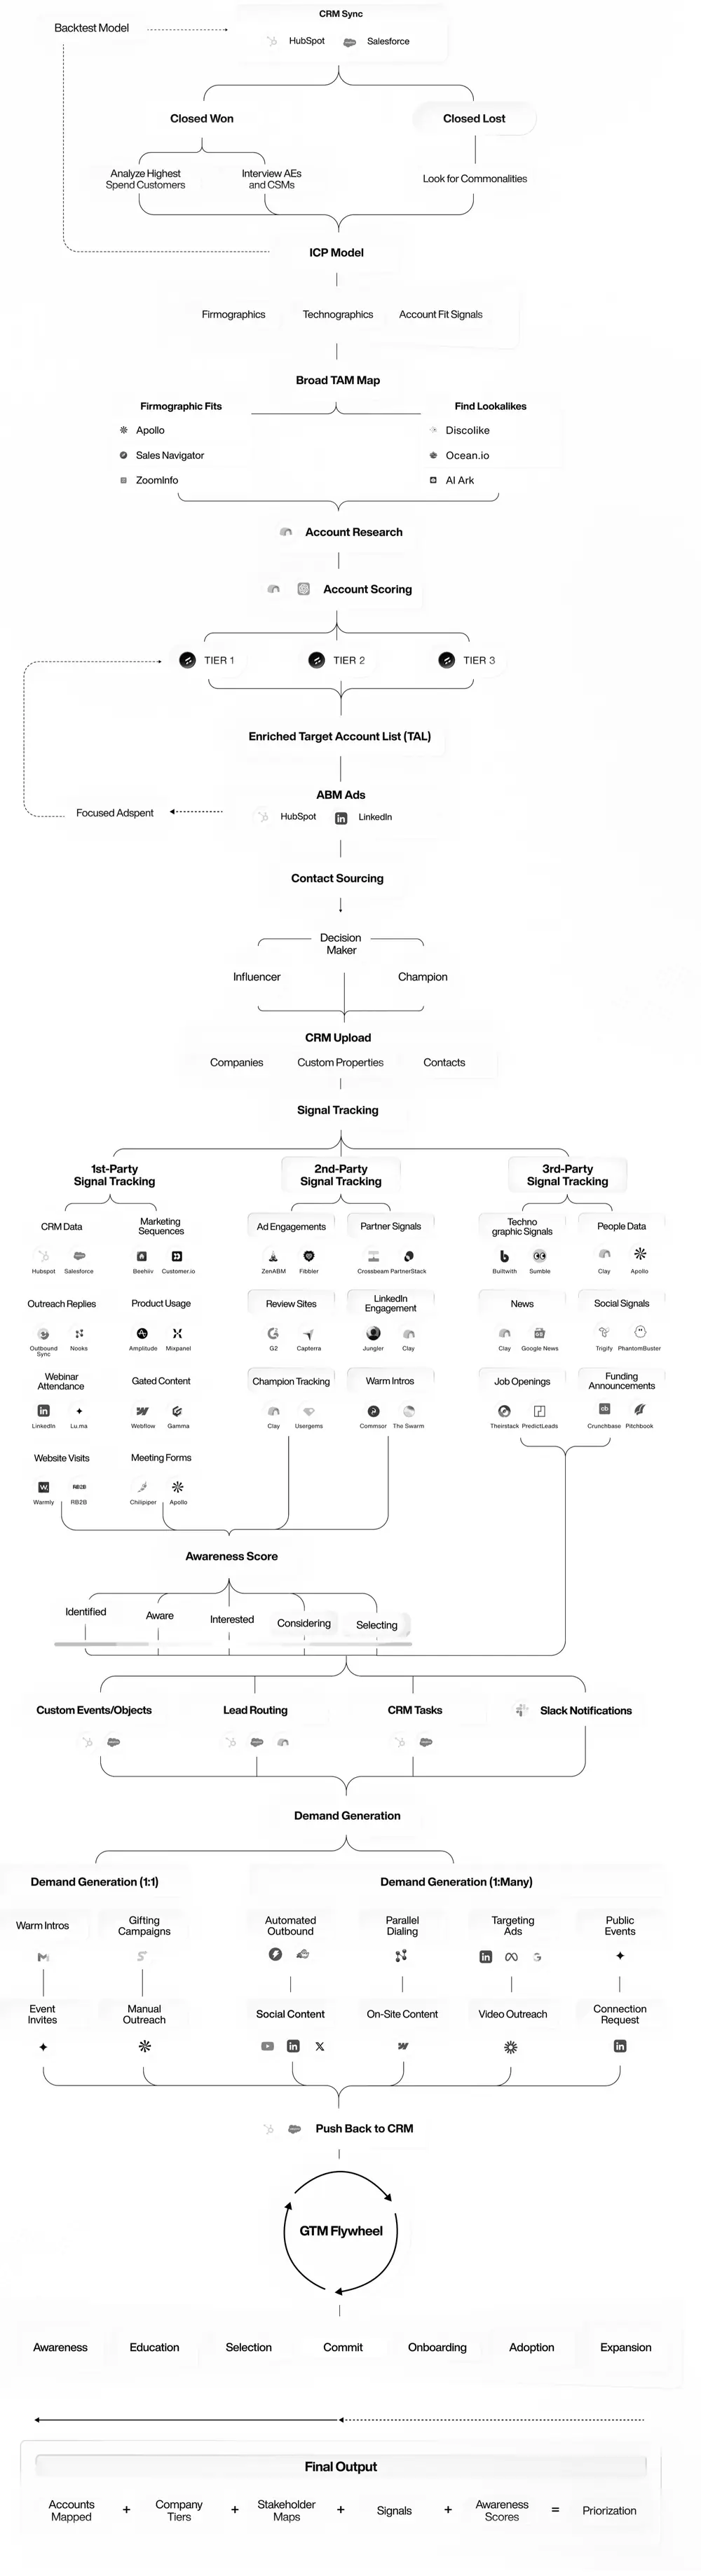
Step 1: TAM and stakeholder mapping
The goal of step one is to create a target account list (TAL) that captures 90 percent or more of your TAM.
Start by building a data-supported ICP (ideal customer profile) model. Plenty of GTM teams do not have their ICP written down in a single agreed document.
Once your ICP is locked in, pull lists from multiple data sources to hit full TAM coverage. There are four main categories.
- General prospecting databases. Like Apollo and ZoomInfo. Best for companies with a LinkedIn presence.
- Lookalike databases. Like Ocean.io and Discolike. Good for hyper-specific searches that include companies missing from LinkedIn.
- Specialized databases. Like Storeleads or influencers.club. Useful for niche verticals.
- Web scraping. Using Apify or Claude Code. Necessary to map TAMs that public databases don't cover well.
Once the company list is qualified, repeat the process for contacts. Map titles to decision-makers, champions, influencers, and end-users. Pull contacts from Apollo, AI Ark, and Clay. Verify emails through Findymail and BetterContact.
Step 2: Account research
After the list is built, you collect the data points that personalize outreach and help reps research accounts without leaving the CRM.
For most clients, this works out to 30+ custom data points, which means 30+ custom CRM properties to configure. Use a spreadsheet to map every data point with its official HubSpot property name and any overwrite rules.
Real examples from clients, in order of simple to complex:
- Engineering headcount
- Custom sub-industry classification
- E-commerce hosting platform
- Competitor tech usage
- Closest coffee spot to the prospect's office
- Recent clinical trials
- Parent-child company relationships
- Composite media-buying score
Use two main tools for research: Claygent (web research agents in Clay) and Clay's 150+ data providers.
Step 3: CRM cleanup and enrichment
Once the static research is done, you turn it into a continuous workflow. Every new record in HubSpot or Salesforce should automatically run through the same enrichment process.
The setup is straightforward:
- Duplicate the TAM workflow.
- Set the trigger to list enrollment (24-hour cadence) or webhooks (instant, requires HubSpot Data Hub Pro).
- Change the final action to "Update record" instead of "Create record".
- Enroll the backfill of companies and contacts.
Typically add an "Enriched by Clay" date field on company and contact records, which makes it easy to re-enrich on a 12-month freshness cycle.
Before pushing any new data, do a CRM cleanup. At a minimum: remove hard domain and email duplicates, and audit existing properties to prevent redundancies. Three tools cover 99 percent of CRM hygiene use cases.
- Clay + HubSpot integration or API
- HubSpot Data Hub
- Claude Code plus the HubSpot MCP
After cleanup, add quality-of-life improvements:
- Customize company and contact views to surface the most important research
- Create segments by tier and category
- Add on-demand enrichment buttons inside HubSpot so reps can click "Find additional stakeholders" without leaving the CRM
Step 4: Signal tracking
Signals are how an ABM engine keeps sales and marketing pointed at the same data. A signal is any data point that suggests buying intent. When marketing drives 50 ad impressions to an ICP account, the sales team can see it, so both teams end up reading the same number: ICP pipeline progression.
Signals split into three categories.
- 1st-party signals. Your internal data from your own tools. CRM activity, website visitors (Warmly, RB2B, Vector), gated content, product usage. Usually free and the highest-intent.
- 2nd-party signals. Exclusive data from external tools. Social engagement (Clay, Jungler, Teamfluence), champion tracking (Clay, Champify, UserGems), ad engagement (ZenABM, Fibbler, Factors.ai).
- 3rd-party signals. Public data from external sources. News and fundraising (Clay, PredictLeads), job openings (LinkedIn Sales Nav, TheirStack), competitor tech usage (BuiltWith, HG Insights).
Use a 13-step process for every signal workflow:
- Capture. Pull signals from all sources via webhooks, APIs, or native integrations.
- Aggregate. Route everything into one orchestration layer.
- Normalize. Standardize key fields like company domain, LinkedIn URL, and job title.
- Enrich. Add basic enrichment for qualification.
- CRM lookup. Check if the account already exists and pull the assigned owner.
- Qualify. Use enrichment data to qualify net-new companies and add to the CRM if missing.
- Score. Pull tier scores (Tier 1, 2, 3, Unqualified) from the CRM.
- Segment. Group accounts by size, industry, location, or business type.
- Route. Assign signals to the right rep using a live rep assignment table.
- Sync to CRM. Push assigned signal data back into HubSpot or Salesforce.
- Activate. Tier 1 gets a Slack alert plus manual outreach. Tier 2 gets retargeting plus automated outbound via Instantly and HeyReach. Tier 3 gets automated email.
- Track. Roll up signals into awareness stages.
- Enablement. Build custom sequences, call scripts, weekly digests, and dashboards per rep.
When the system works, 20 to 40 percent of active pipeline traces back to signal activation (using a 7-day deal creation window).
Step 5: Awareness scoring
Awareness scoring is a strategy I learned from Growth Unhinged, particularly the case studies with Parabola and Emilia Korczynska.
The five awareness stages:
- Identified. Part of the qualified TAL, no engagement yet. Default state.
- Aware. Showed surface-level engagement. One website visit, 50+ ad impressions.
- Interested. Repeated or high-intent engagement. A positive outbound reply, event attendance.
- Considering / Evaluating. Bottom-funnel stage just before the biggest conversion drop-off, usually right before the first meeting.
- Selecting. In an active deal cycle with an opportunity in the CRM.
When an account moves stages, you have a few activation options:
- Tasks and Slack notifications for high-intent signals
- Lists that reps prospect from (e.g. Tier 1 + 2 in Interested)
- AI signal summaries added to the task description every time the stage changes
Lifecycle stages start after an opt-in, so the warm activity that happens before the form fill never shows up. Awareness stages cover that gap.
Step 6: Demand generation
The core ABM infrastructure is in place by step six, which puts demand generation on the table:
- Awareness score segments become ad retargeting audiences
- SDRs stop list-building outside the CRM entirely
- Sales naturally focuses on Interested and Aware accounts (which convert 3x higher)
- Sales starts using marketing-generated signals to fill pipeline
ABM demand gen channels split into two groups.
- 1:1 demand generation. ABM gifting campaigns, warm intros, event invites, and manual outreach for dream accounts.
- 1:many demand generation. Automated outbound through Instantly and HeyReach, parallel dialing through Nooks or Orum, LinkedIn social content, on-site lead magnets, video outreach, targeted ads, public event campaigns, and connection request waves.
Targeted LinkedIn ads deserve a closer look here. A small TAM is an advantage: upload the company and contact lists and 100 percent of your spend lands on ICP accounts.
Step 7: ICP pipeline progression reporting
Reporting is straightforward once the data is clean. These six reports are the ones an ABM program lives on.
- ICP pipeline created (month over month). The clearest read on whether the program is working. It should grow from baseline.
- Signal influence by category. Model each signal category against pipeline and closed-won, using 7-day and 30-day attribution windows.
- Overdue signal tasks by rep. Tasks only work if reps action them, so the percentage overdue tells you who needs more enablement.
- Awareness stage progression and regression by tier. Accounts moving forward predict future pipeline. Accounts moving backward expose leaks before they show up in revenue.
- Accounts by tier broken down by awareness stage. The high-level market penetration view.
- Tier 1 accounts with no activity in the last 30 days. An accountability metric, and one that should sit close to zero.